Long Description for I Don't See Color.png
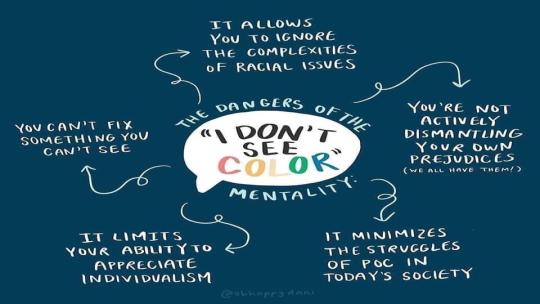
The Dangers of the "I Don't See Color" Mentality
- It allows you to ignore the consequences of racial issues
- You can't fix something you can't see
- It limits your ability to appreciate individualism
- You're not actively dismantling your own prejudices (we all have them)
- It minimizes the struggles of People of Color (POC) in society